We provide a minimal example how to serve tensorflow models on a Kubernetes cluster and monitor them with Prometheus and Grafana. To expose the models we create a deployment and service manifests, whereas for the deployment of Prometheus and Grafana we use the corresponding helm charts provided by bitnami. We also briefly explain the process of transforming a tensorflow model into a servable. The full code can be found in this Github repository.

1. Creating and exposing tf models as REST APIs
To keep things simple we use trivial models, like f(x)=x/2+2 but the idea can be applied to any
subclass of tf.Module that has the .save() method. A minimal example is provided
below:
In the directory where the model is saved you can find a saved_model.pb file. It stores the
TensorFlow model, and a set of named signatures, each identifying a function that accepts tensor inputs and
produces tensor outputs. Whereas tf.Keras models automatically specify serving signatures, for custom modules
you have to declare them explicitly, as described
here. To get an
overview of the available signatures you can use the saved_models_cli in your cli. Usually, you
will only have and need the serving_default signature. For the example presented above you can
obtain the inputs and outputs of the serving_default signature with the following command:
As a next step, we use the official tensorflow/serving
image to expose the saved models as a REST API (you
can use the same image to make grpc calls against the models but this won’t be covered here). An example, how
to run the container, mount the saved model (assuming that it is stored in $(pwd)/models), and
make a REST call is provided below:
In this example we made 3 predictions of f(x)=x/2+2 for x=0,1,2. Note that in the POST request we
had to specify the signature name serving_default and to make the input data compliant with the
signature definition.
To serve multiple models we do not only have to mount them in the image but also have to specify a config file
that maps the model location to a service path. For example, if we have 3 models mounted in the
/models directory, as described below,
we can use the following configuration (mounted in /models/models.config):
You can copy the content in /models from
here. To start the service
we will use the same tensorflow/serving image but with few extra arguments:
- The
model_config_file_poll_wait_secondsflag instructs Tensorflow Serving to periodically poll for updated versions of the configuration file specified by themodel_config_fileflag.
- The
version_labelssection of the config file allows us to map different model versions to the same endpoint. In this example, calling the endpoints/half_plus_ten/labels/stableand/half_plus_ten/labels/canaryis equivalent to calling/half_plus_ten/versions/1and/half_plus_ten/versions/2, respectively.
- The
allow_version_labels_for_unavailable_modelsflag allows us to assign a label to a version that is not yet loaded.
In this example the following service calls are possible (you can pick each one of the three
MODEL_PATH by commenting out the other two):
2. Kubernetes deployment
For simplicity, we use a Kubernetes cluster deployed on a local machine. This prevents us, for example, to simulate exactly how the new tensorflow models are mounted and served but all other configurations presented below can be used for the cloud deployment.
To reproduce the steps listed below, you need a local Kubernetes installation, like Docker Desktop or Rancher Desktop, and the helm package manager that automates the deployment of software for Kubernetes.
2.1 Tensorflow serving
We create a single deployment that is exposed to the other components in the cluster through a service. In the ideal case, the exported models should be made available to the tf-server pods by mounting them as volumes. Instead, the pods in the deployment will be running containers that already contain the models. The Dockerfile that creates them is given below:
We can create the container, the kubernetes namespace, deployment and service with the following commands:
where the content of tf-serving.yaml is given below:
In this repository you can also find the corresponding helm chart. From the yaml file we can see that:
-
We are pulling the locally stored tensorflow server image by setting
pullPolicy: Never(line 21). This line should be changed if we are using a cluster on the cloud (in addition to pushing thetf-server:1.0.0image to a container registry).
-
We provide a monitoring configuration to the server by using the
rest_api_portflag and themonitoring_config_fileflag (line 24, 27). The latter flag points to the/models/monitoring.configfile that has the following content:
-
All metrics that can be scraped by Prometheus are accessible at path
/monitoring/prometheus/metricsand port 8501. You can see them by browsing tohttp://localhost:8501/monitoring/prometheus/metrics.
-
We are using a service of type
LoadBalancer(line 42). If the service is intended to be used only by other components in the same cluster then we could change the type of the service toClusterIP. We should be able to make API calls to the service in the same way as we did in the previous section.
2.2 Prometheus
We will use helm to install all Prometheus components. Since it provides us with a working application out of the box we do not have change its default settings. We only have to provide the instructions how to discover the pods of the Model Server and extract information from them. We can do this by:
-
storing the configurations as a secret in the same namespace where Prometheus is deployed and providing
the secret name and key to Prometheus.
-
defining the configurations to be managed by the Helm. In this case a change of the configurations
requires a new release version.
It defines a scrape job that looks for pods with the label app: tf-serving (line 13) in the
tfmodels namespace (line 17) and every 5s it checks for new data by calling
/monitoring/prometheus/metrics on port 8501. To install all Prometheus components execute:
You should get a message telling you under which DNS from within the cluster Prometheus can be accessed.
To access Prometheus from outside the cluster execute:
kubectl -n monitoring port-forward svc/ (the service name is obtained
from the panel above). After few minutes when all Prometheus components are installed you can access the
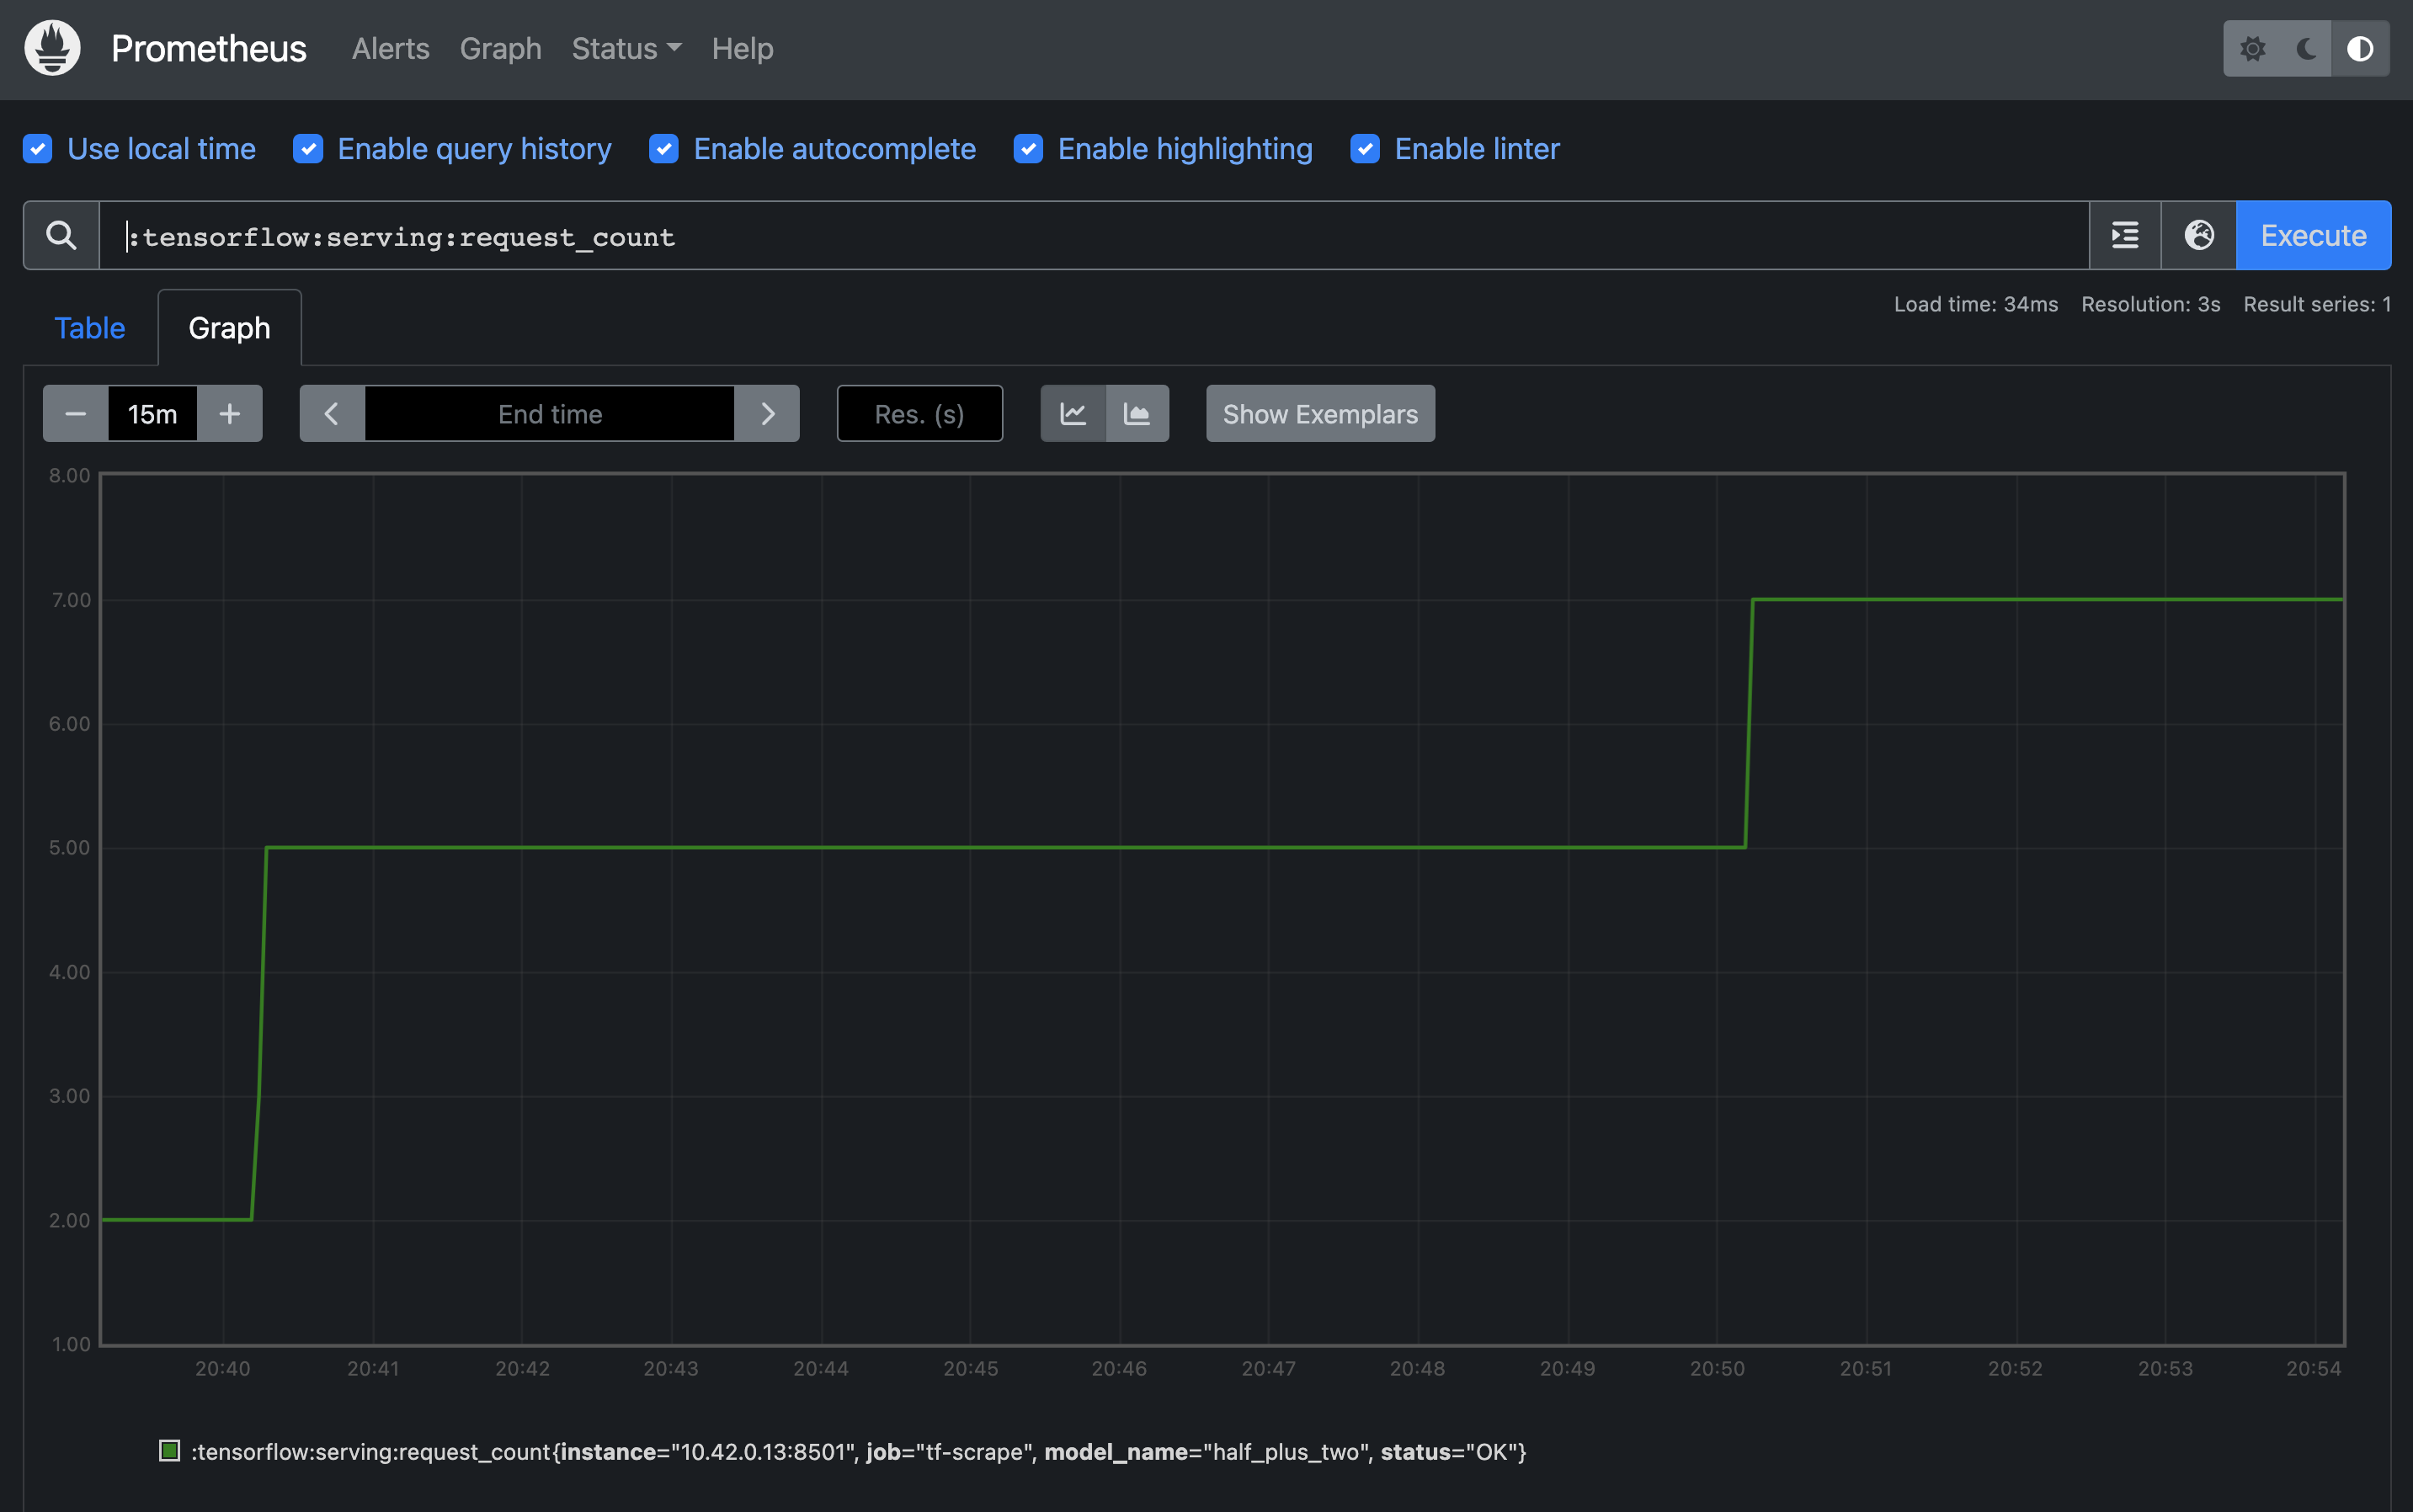
Prometheus UI at http://127.0.0.1:9090. You can execute the query
:tensorflow:serving:request_count and check how the graph changes after making several API calls
to the tf model service.
2.3 Grafana
We will use helm to install Grafana. No additional configurations are required:
You should automatically get the following instructions how to access the Grafana dashboard (note that in the panel below the kubectl namespace flag is skipped; you should not skip it):
To access Grafana from outside the cluster execute
kubectl -n monitoring port-forward svc/grafana-chart 8080:3000 and browse to
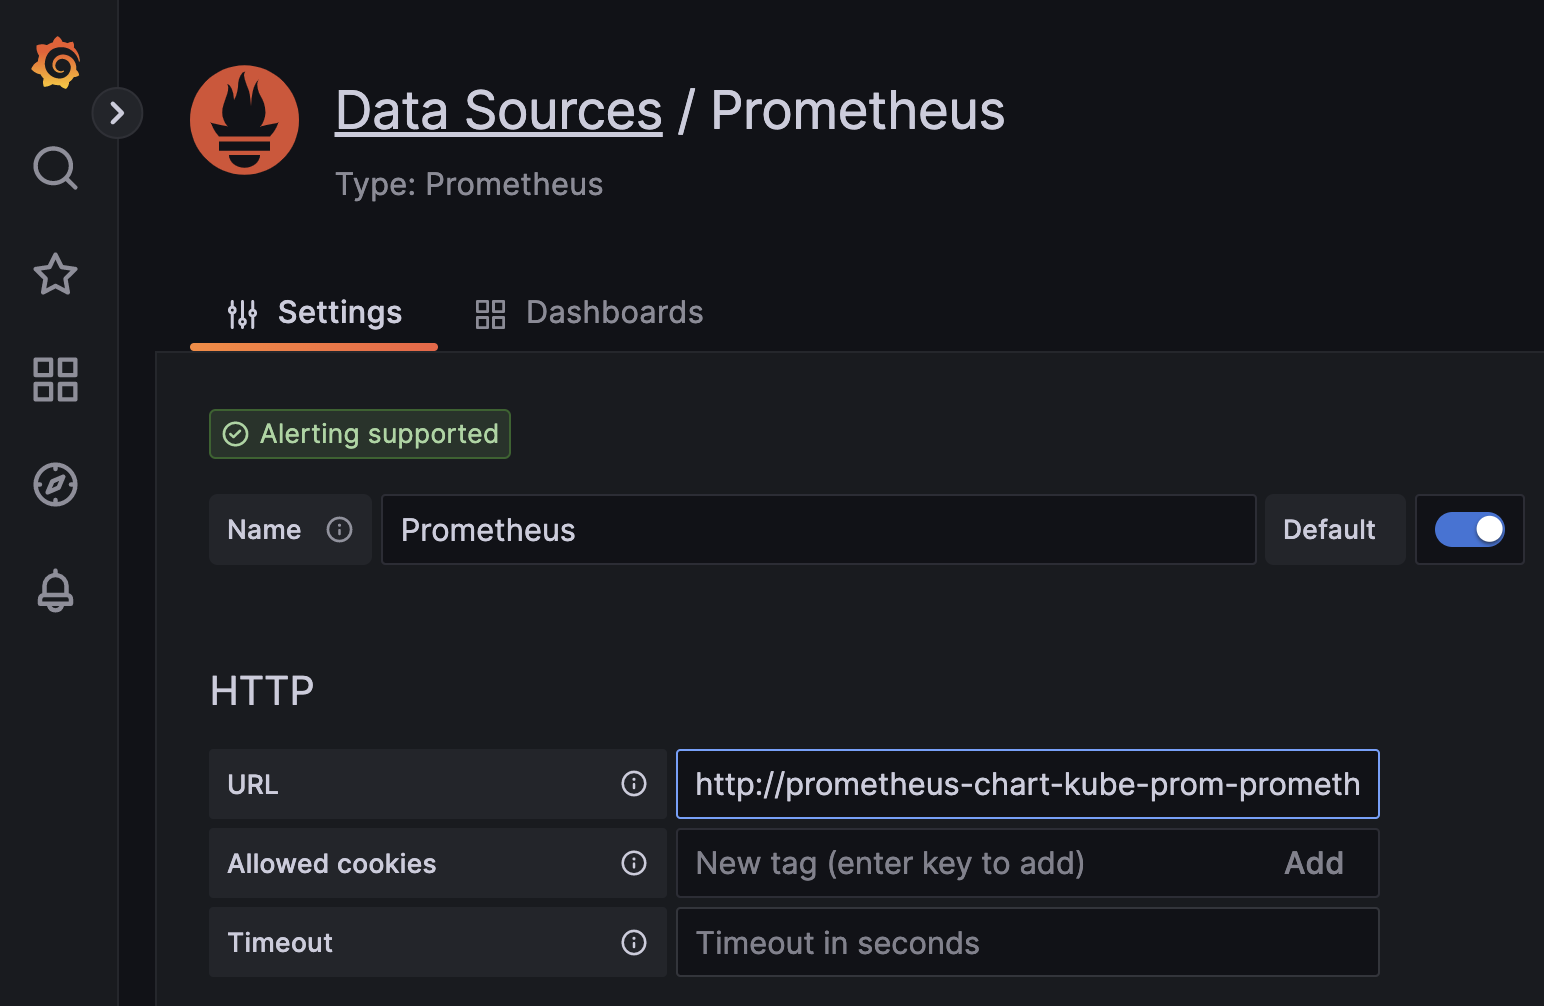
http://127.0.0.1:8080 to access the service. You can add Prometheus as a datasource
by using the previously obtained prometheus DNS name as a datasource URL:
http://
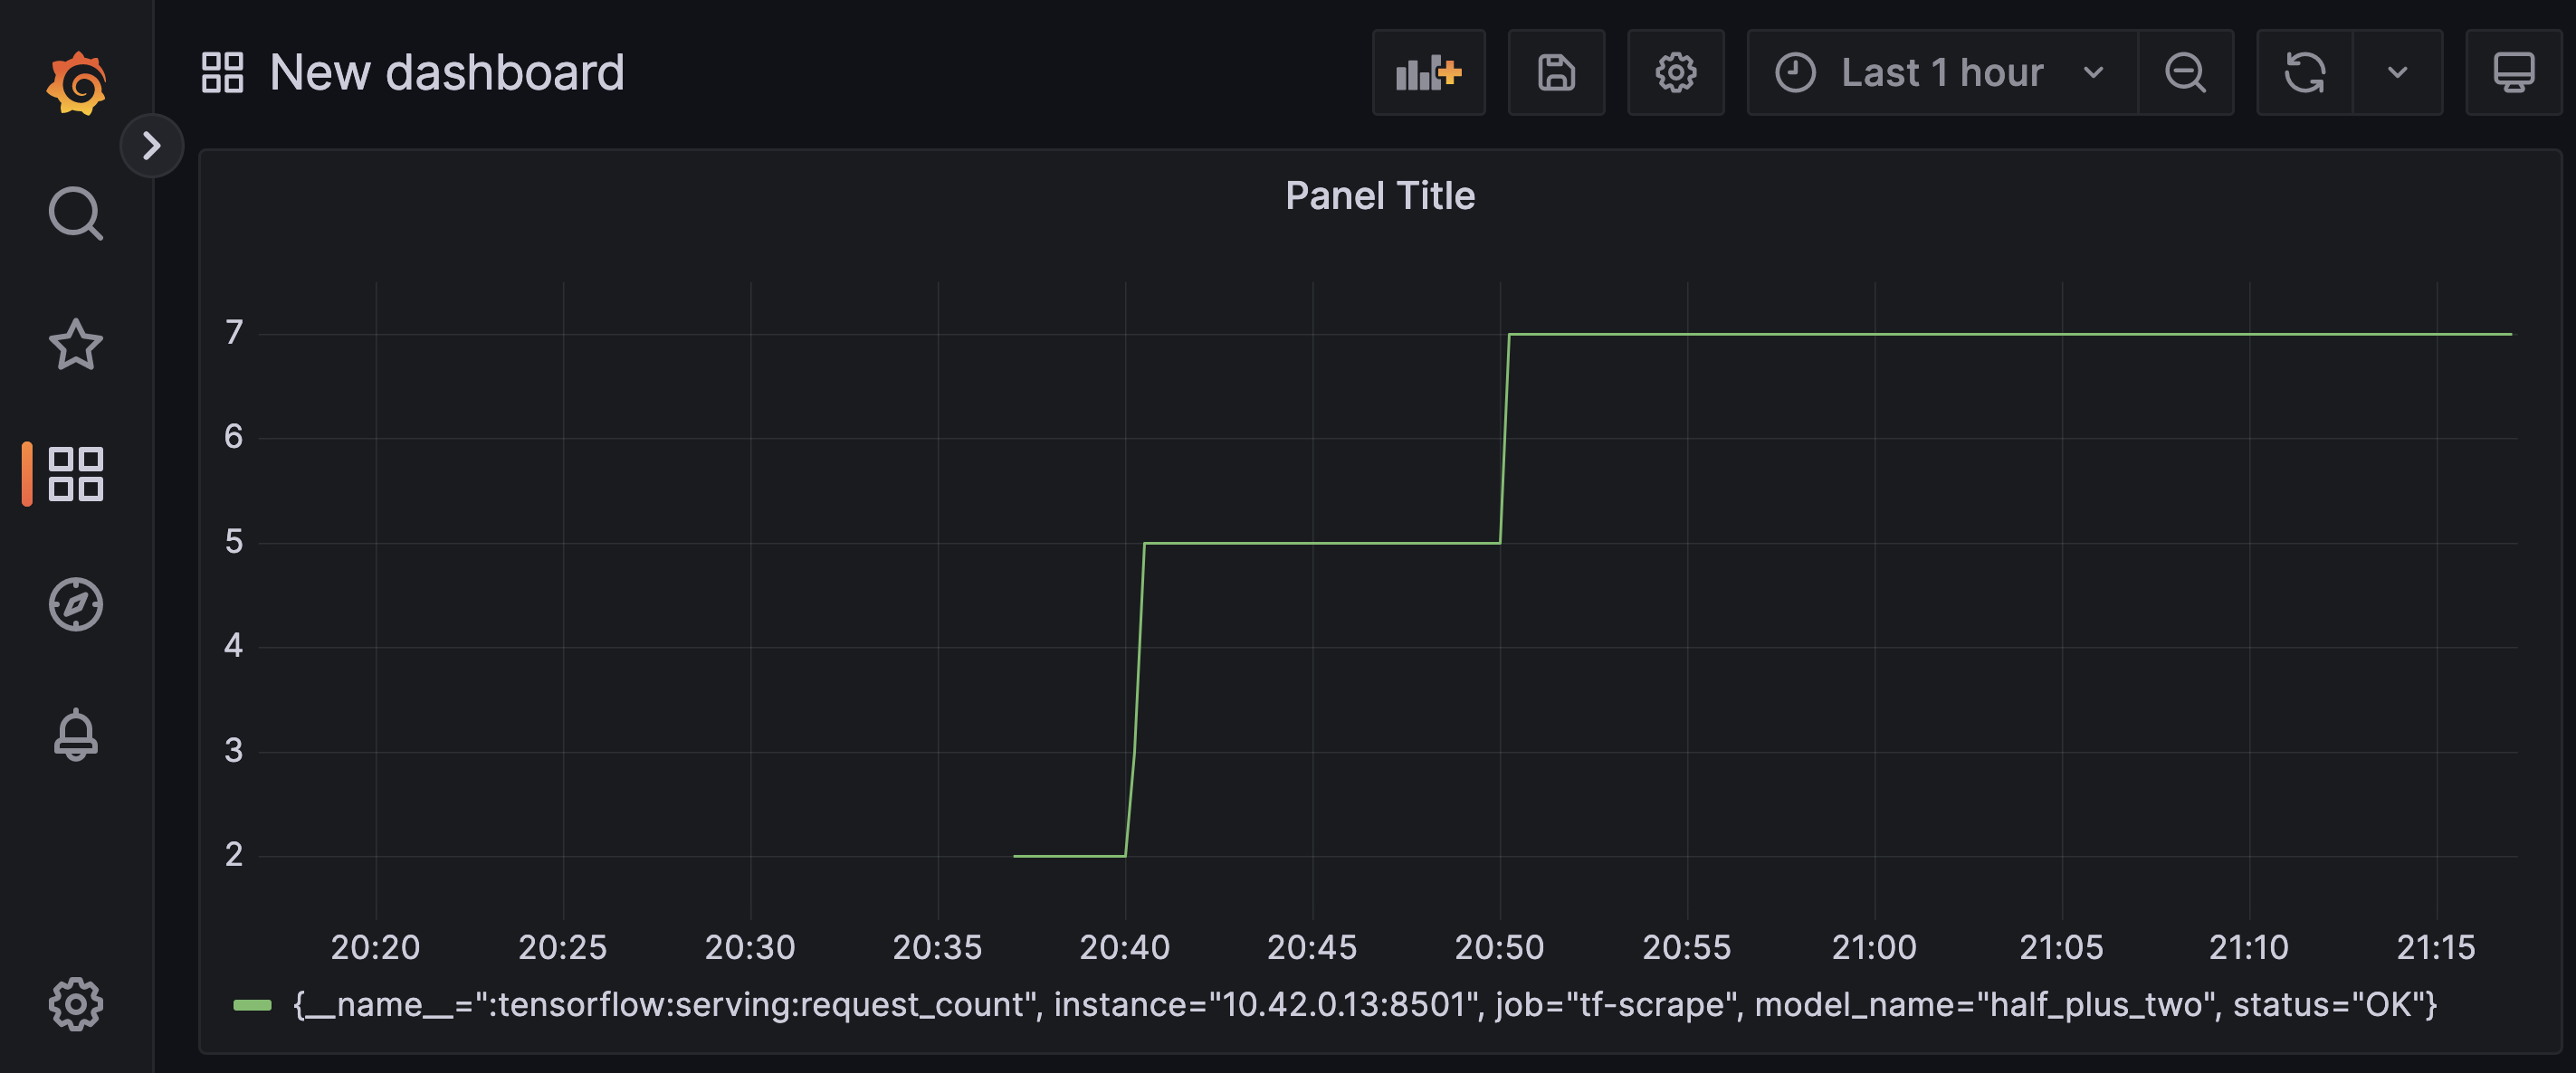
Now you should be able to create your first dashboard by using the metric
:tensorflow:serving:request_count and Prometheus as a data source.
To remove all components that you have installed execute:
3. References